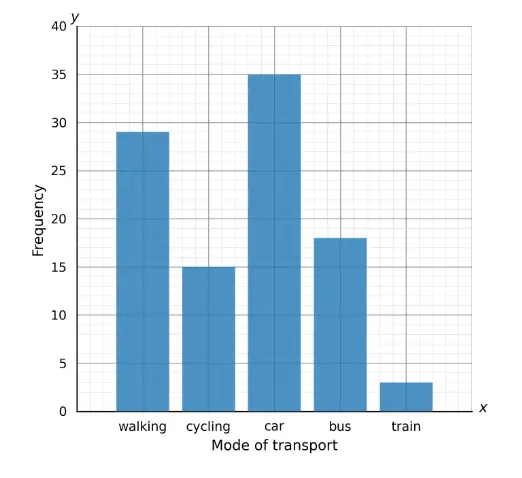
students were asked what their primary mode of transport for getting to school was. The results of this survey are recorded in the table below. Construct a bar graph representing this information.

Question 2:
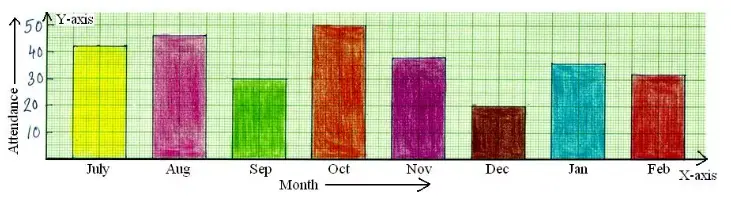
The average monthly attendance of a class is given.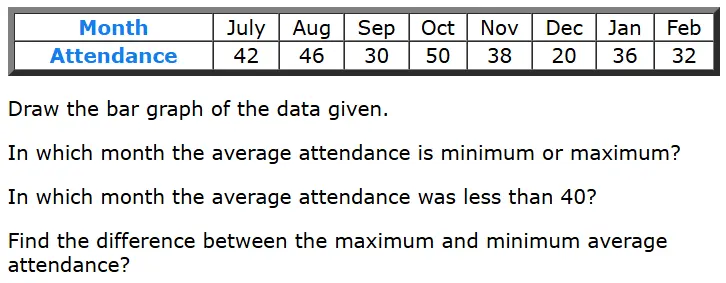
Question 3:
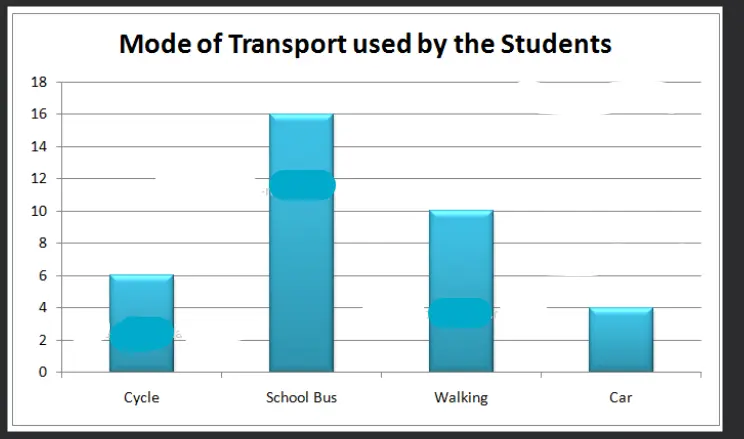
A survey of 36 students of a class was done to find out the mode of transport used by them while commuting to the school. The collected data is shown in the table given below.
|
Mode of Transport Cycle School Bus Walking Car |
Number of Students 6 16 10 4 |
(i) Construct a bar graph representing this information. And Give a suitable title for the graph.
(ii) Write down which mode of transport is used by most of the students?
iii) Calculate the percentage of students use a car for commuting?
iv) Discuss why do you think the school bus is the most preferred mode of transport among students?
Answer 1:
Answer 2:
-
Maximum and Minimum Attendance:
-
Maximum attendance: 50 (in October)
-
Minimum attendance: 20 (in December)
-
-
Months with attendance less than 40:
-
September (30)
-
November (38)
-
December (20)
-
January (36)
-
February (32)
-
-
Difference between maximum and minimum attendance:
-
50−20=30
-
Answer 3:
-
Which mode of transport is used by most of the students?
-
The school bus is used by the most students, with 16 out of 36 students commuting this way.
-
-
What percentage of students use a car for commuting?
-
Number of students using a car = 4
-
Total number of students = 36
-
Percentage = (4/36)×100=11.11%
-
So, 11.11% of students use a car for commuting.
-
-
Why do you think the school bus is the most preferred mode of transport among students?
-
The school bus is likely the most preferred mode because:
-
It is safe and reliable for students.
-
It is often more affordable than private transport.
-
It helps students arrive on time and reduces traffic congestion around the school.
-
Parents might prefer it for convenience and to ensure their children travel with their peers.
-
-